

New Home Sales Grew 28.1% YOY In January As The Spring Selling Season Starts Early According To Zonda
COSTA MESA, Calif. (PRWEB)
February 22, 2021
Today, the experts at Zonda, the housing industry’s foremost advisors, released the New Home Pending Sales Index (PSI) for January 2021. The New Home PSI shows pending sales decreased month-over-month but increased year-over-year across the United States. The index is a leading residential real estate indicator based on the number of new home sales contracts signed across the country.
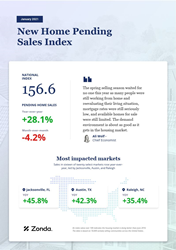
The New Home PSI came in at 156.6 for January, representing a 28.1% increase from January 2020. On a month-over-month basis, new home sales fell by 4.2% from December.
“The spring selling season waited for no one this year as many people were still working from home and reevaluating their living situation, mortgage rates were still seriously low, and available homes for sale were still limited, said Ali Wolf, Zonda’s chief economist. “The demand environment is about as good as it gets in the housing market.”
Pending new home sales trended above January 2020 levels in 16 of our select 20 top markets. The best new home markets in January were Jacksonville, Austin, and Raleigh. These markets have been consistently among the top performers in the country driven by migration trends, relative affordability, and a desirable quality of life.
This month, we are introducing an additional layer of detail. The New Home PSI is made up of two components: new home orders and the average sales rate per community. New home orders look at total sales and will fall based purely on limited supply. The average sales rate per community captures how well builders are selling at the open communities and strips out the supply side. Both, however, can be negatively impacted by builders intentionally capping sales. The included table shows the year-over-year change for the two components and is sorted by the spread to quickly identify the markets where supply is impacting sales the most. Note that the PSI calculation includes weights and seasonal adjustments. The year-over-year changes in the table removes both and are just looking at the raw index values.
As seen, the spread between the index value for new home orders and the average sales rate per community is particularly large in two types of markets: 1. Places like Jacksonville, Denver, and Tampa, the migration winners throughout 2020 and early-2021 and 2. Big cities like Washington, DC and Philadelphia where developable land is harder to find, impacting the total market potential. Salt Lake City and Las Vegas are the only two of our select metros to post a year-over-year drop in the average sales rate per community. Both are markets that have be inundated with newcomers from out of state and, as such, builders have needed to cap their average sales rate per community in order to better balance contract sales with deliveries.
“Builders have repeatedly raised their prices in an attempt to temper the insatiable demand, but the power of mortgage rates has allowed many buyers to meet the higher price points,” explains Wolf. “Demand is so hot right now that campouts are back at select communities and some builders have reported hitting the best weeks and/or months in the history of their companies.”
New home data is susceptible to outsized swings in contract activity based on shifts in the number of actively selling communities. As a result, Zonda normalizes the data to ensure consistency across the index. The New Home PSI blends the cumulative sales of active or recently sold-out projects with the average sales rate per community, which adjusts for fluctuations in supply. Furthermore, the New Home PSI is seasonally adjusted based on each markets’ specific seasonality and removes outliers. The index is baselined to 100 for June 2016. Today’s national New Home PSI is 57% above the base level.
The next Zonda New Home PSI press release, featuring February 2021 data, will be issued on Monday, March 19, 2021 at 9:00 a.m. ET.
Methodology
The Zonda New Home Pending Sales Index (PSI) is built on proprietary, industry-leading data that covers 60% of the production new home market across the United States. Reported number of new home pending contracts are gathered and analyzed each month. Released on the 15th business day of each month, the New Home PSI is a leading indicator of housing demand compared to closings because it is based on the number of signed contracts at a new home community. Zonda monitors 18,000 active communities in the country and the homes tracked can be in any stage of construction.
The new home market represents roughly 10% of all transactions, allowing little movements in supply to cause outsized swings in market activity. As a result, the New Home PSI blends the cumulative sales of activity recently sold out projects with the average sales rate per community, which adjusts for fluctuations in supply. Furthermore, the New Home PSI is seasonally adjusted based on each markets’ specific seasonality, removes outliers, and uses June 2016 as the base month. The foundation of the index is a monthly survey conducted by Zonda. It is necessary to monitor both new and existing home sales to establish an accurate picture of the relative health of the residential real estate market.
About Zonda
Zonda provides data-driven housing market solutions to the homebuilding and multifamily industries. From builders to building product manufacturers, mortgage clients, and multifamily executives, we work hand-in-hand with our customers to streamline access to housing data to empower smarter decisions. As a leading brand in residential construction, our mission is to advance the home building industry, because we believe better homes mean better lives and stronger communities. Together, we are building the future of housing.
Share article on social media or email: